Enhancing Edge Container Observability with Inspektor Gadget and Sentinel (PoC)
Hey there 🖖 - In a recent project, I tackled a scenario where we aimed to enhance container network observability for Arc-enabled clusters deployed at customer edge sites to potentially utilize the collected signals in Microsoft Sentinel and respecitively in Defender XDR.
Unlike AKS nodes, where we can leverage tools like VNet Flow Logs or DNS Security Policies for deep network insights on VNet level as described in my previous blog post, edge environments may lack the necessary network and monitoring infrastructure. This results in limited egress logging and monitoring capabilities, making it harder to detect suspicious behavior and anomalies in central manner.
👉If you would prefer not to scroll through the entire blog post, you can access the YAML here https://github.com/pisinger/scripts-lib/blob/main/k8s/inspektor-gadget-ig-ds-multi-gadgets.yaml and the KQL queries here https://github.com/pisinger/hunting/blob/main/container-signals-via-inspektor-gadget.kql 😅
Tip: AKS recently introduces a new feature around ACNS (Azure Container Networking Services), leveraging the Azure Monitor Addon and Hubble to collect
container network logsat scale in Azure. Learn more about it here: https://learn.microsoft.com/en-us/azure/aks/container-network-observability-logs
🎯The challenge to retrieve observability data in a manner to use it in Sentinel
That being said, network observability itself is not the core challenge - there are several open-source and lightweight tools that can provide visibility even in constrained environments. The real hurdle lies in integrating these insights into a centralized security and monitoring pipeline.
To achieve this, we could go with a custom data pipeline using fluent-bit or similar tools, but this approach can be cumbersome and time-consuming.
Thus I decided to first explore options using existing tools such as Azure Monitor Agent when using Container Insights (https://learn.microsoft.com/en-us/azure/azure-monitor/containers/container-insights-data-collection-configure). This is a great option for monitoring and logging, but it doesn’t provide the level of observability we need for network traffic in this specific edge case - but thats fine as for now we are only looking for a data pipeline we could leverage instead of going the custom way.
👉 So far, so good. The next step was to identify a tracing tool that logs directly to stdout, allowing us to collect this data natively via Container Insights and subsequently ingest the logs into our Log Analytics Workspace. This approach enables us to utilize the existing data pipeline without reinventing the wheel, while still obtaining the necessary insights.
🕵️♂️Inspektor Gadget
Luckily, I already had a tool in mind -> Inspektor Gadget 🚀
Originally developed by Kinvolk (https://kinvolk.io/), a company known for its Linux and Kubernetes tools, which was acquired by Microsoft in 2021. It’s worth noting that since February 2024, the Defender Container sensor is been powered by Inspektor Gadget. Given this background, it’s quite obvious why I chose it, right? 😊🥳
Inspektor Gadget is an open-source collection of eBPF-based observability tools purpose-built for Kubernetes environments. It is a CNCF sandbox project, originally developed by Kinvolk (now part of Microsoft), and designed to help developers and operators gain deep insights into containerized workloads with minimal overhead. At its core, Inspektor Gadget leverages eBPF - a powerful Linux kernel technology that allows sandboxed programs to run safely and efficiently within the operating system kernel. While eBPF was originally created for low-level network packet filtering, it has since evolved into a versatile platform for networking, observability, tracing, and security. https://inspektor-gadget.io
Inspektor Gadget offers a powerful and extensible solution which is based on so called gadgets (https://inspektor-gadget.io/docs/latest/gadgets). This moduluar approach allows us to trace specific scenarios and many more quite easily such the below - so you see, it is not limited to collecting network signals:
- trace_tcp
- trace_dns
- trce_sni
- trace_exec
- audit_seccomp
Each gadget is designed to capture specific telemetry data, such as network traffic, system calls, or other where Inspektor Gadget manages the lifecycle of the gadgets by pulling their container images from an OCI registry, loading the associated eBPF programs into the kernel, and processing the telemetry they generate. This modular architecture also allows users to develop custom gadgets to meet specific observability needs.
- Check the architecture reference here: https://inspektor-gadget.io/docs/latest/reference/architecture
- For how to install on k8s, check https://inspektor-gadget.io/docs/latest/reference/install-kubernetes/
1
2
3
4
5
6
7
8
# option 1 - install via krew package manager
kubectl krew install gadget

# option 2 - install manually using specific version
$ IG_VERSION=$(curl -s https://api.github.com/repos/inspektor-gadget/inspektor-gadget/releases/latest | jq -r .tag_name)
$ IG_ARCH=amd64
$ curl -sL https://github.com/inspektor-gadget/inspektor-gadget/releases/download/${IG_VERSION}/kubectl-gadget-linux-${IG_ARCH}-${IG_VERSION}.tar.gz  | sudo tar -C /usr/local/bin -xzf - kubectl-gadget
$ kubectl gadget version
Once the client is installed as a kubectl plugin, you can proceed to deploy the Inspektor Gadget DaemonSet to your Kubernetes cluster. This setup is all that’s needed to run various gadgets and capture telemetry data from your containers and pods.
1
2
# Deploy the Inspektor Gadget DaemonSet
kubectl gadget deploy
To run the specific gadgets, you can use the kubectl gadget command. For example, to run the trace_tcp gadget for collecting tcp connection metrics, you would execute:
1
kubectl gadget run trace_tcp:latest
1
2
# to remove the gadget ds
kubectl gadget undeploy
That’s it! But wait - this does not bring the events into Sentinel yet, right? Why, because the DaemonSet is <not> logging the events to stdout by default, thus we need to configure something to make this happen. Long story short, there is no built-in option available yet to achieve this when going with the above DaemonSet - while there is also a headless (https://inspektor-gadget.io/docs/latest/reference/headless) option to run the gadgets, it still does not allow us to collect the logs via Container Insights from stdout.
Spoiler Alert: We have to use the
ig tool(https://inspektor-gadget.io/docs/latest/reference/ig) which indeed logs to stdout and which we also could run as a DaemonSet. To make this happen, I went for a custom yaml deployment to pull and run ig as container which then runs the gadgets. With this we eventually have everything we need to continue with our technical proof of concept.
While Inspektor Gadget typically interacts with the kube API, there are cases where direct container tracing is needed. For those situations, the ig CLI tool lets you gather insights straight from the container runtime — bypassing Kubernetes entirely.
1
2
sudo ig run ghcr.io/inspektor-gadget/gadget/trace_tcp:latest
sudo ig run ghcr.io/inspektor-gadget/gadget/trace_tcp:latest -o json
In summary, there are various ways to utilize Inspektor Gadget, but the most prevalent method is to run it as a DaemonSet. This approach enables deployment across all nodes, ensuring it is prepared to capture telemetry data from any pod or container within the cluster.
Inspektor Gadget comes with basically 2 flavors:
- DaemonSet to run on demand including headless mode (which is not logging to stdout)
- IG tool (which we will also run as DaemonSet as described later in this blog post)
🛠️Deploy Part 1 - Enable Azure Monitor Container Insights (arc enabled k8s)
The initial step involves preparing our log pipeline using Azure Monitor Container Insights. To enable this on an Arc-enabled Kubernetes cluster, you can utilize the Azure CLI to create the appropriate Azure Monitor extension, allowing us to collect logs and metrics and ingest them into an Azure Log Analytics workspace.
Note: If your cluster is not Arc-enabled yet, then first follow the steps from here https://learn.microsoft.com/en-us/azure/azure-arc/kubernetes/connect-cluster to connect your cluster to Azure Arc.
See below to prepare your az cli to finally connect your cluster:
1
2
3
4
5
6
7
8
9
10
11
12
13
14
15
# add extension
az extension add --name connectedk8s

# register resource providers
az provider register --namespace Microsoft.Kubernetes
az provider register --namespace Microsoft.KubernetesConfiguration
az provider register --namespace Microsoft.ExtendedLocation

# wait for the providers to be registered
az provider show -n Microsoft.Kubernetes -o table
az provider show -n Microsoft.KubernetesConfiguration -o table
az provider show -n Microsoft.ExtendedLocation -o table

# connect your cluster to arc
az connectedk8s connect --name "your-edge-cluster-name" --resource-group "ResourceGroup" --location "westeurope"
Once the cluster is connected, we can proceed to provision the Azure Monitor extension to enable Container Insights.
1
az k8s-extension create --cluster-type connectedClusters -c "your-edge-cluster-name" -g "ResourceGroup" --extension-type "Microsoft.AzureMonitor.Containers" --name "azuremonitor-containers" --configuration-settings logAnalyticsWorkspaceResourceID=$WorkspaceId
After completing this step, the following new pods will be created in the kube-system namespace
1
2
kube-system      ama-logs-dfrgr                  3/3     Running
kube-system      ama-logs-rs-6cc6d544d4-bs4wz    2/2     Running
🛠️Deploy Part 2 - IG tool as DaemonSet
The final step is to deploy the Inspektor Gadget IG tool as a DaemonSet. This deployment will enable you to run the ig tool and various gadgets across all nodes, allowing you to capture telemetry data from any pod or container within the cluster.
See below an example yaml which runs the trace_tcp gadget and logs the output to stdout in JSON format. For other examples check https://github.com/inspektor-gadget/inspektor-gadget/tree/main/docs/examples.
1
2
3
4
5
6
7
8
9
10
11
12
13
14
15
16
17
18
19
20
21
22
23
24
25
26
27
28
29
30
31
32
33
34
35
36
37
38
39
40
41
42
43
44
45
46
47
48
apiVersion: apps/v1
kind: DaemonSet
metadata:
  name: ig
  labels:
    k8s-app: example-ig
spec:
  selector:
    matchLabels:
      name: example-ig
  template:
    metadata:
      labels:
        name: example-ig
    spec:
      containers:
      - name: ig-tcp
        image: ghcr.io/inspektor-gadget/ig:latest
        resources:
          limits:
            memory: "256Mi"
            cpu: "90m"
          requests:
            memory: "128Mi"
            cpu: "30m"
        securityContext:
          privileged: true
        command: ["ig", "run", "trace_tcp:latest","-o", "json"]
        env:
        - name: HOST_ROOT
          value: "/host"
        volumeMounts:
          - mountPath: /host
            name: host
          - mountPath: /sys/kernel/debug
            name: debugfs
          - mountPath: /run
            name: run
      volumes:
        - name: host
          hostPath:
            path: /
        - name: debugfs
          hostPath:
            path: /sys/kernel/debug
        - name: run
          hostPath:
            path: /run
A version to run multi gadgets at a time can be found in my Github repo https://github.com/pisinger/scripts-lib/blob/main/k8s/inspektor-gadget-ig-ds-multi-gadgets.yaml. See below to deploy this multi container DaemonSet directly to your cluster:
1
2
3
4
5
6
7
8
# create your namespace for Inspektor Gadget
kubectl create ns gadget

# deploy the DaemonSet with the IG tool
kubectl apply -f https://raw.githubusercontent.com/pisinger/scripts-lib/refs/heads/main/k8s/inspektor-gadget-ig-ds-multi-gadgets.yaml -n gadget

# to delete
kubectl delete ds ig -n gadget
Note: Ensure that the namespace you specified earlier is not excluded in the Container Insights configuration, and that ContainerLogV2 is enabled. This will ensure that logs are properly collected and sent to your Log Analytics workspace. For more information, check https://learn.microsoft.com/en-us/azure/azure-monitor/containers/container-insights-data-collection-configure.
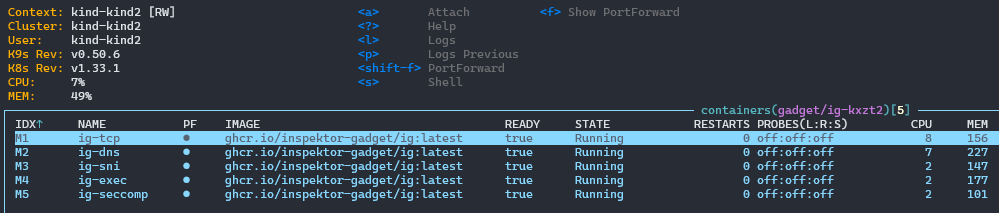
To verify that the DaemonSet with the multi gadget is running and properly collecting logs, you may want to use k9s https://github.com/derailed/k9s
🔍 Hunting across the collected signals
Once everything is deployed, let’s head to the workspace to begin investigating the network traffic and other telemetry data collected by Inspektor Gadget. The following queries can be used to retrieve the relevant logs from the ContainerLogV2 table in your Log Analytics workspace.
The first example involves SNI (Server Name Indication) traffic events, which are commonly used in TLS connections to specify the hostname being connected to. This is especially useful for identifying the target of encrypted connections.
1
2
3
4
5
6
7
8
9
10
11
12
13
14
ContainerLogV2
| where ContainerName == "ig-sni"
| extend
    log_namespace = tostring(LogMessage.k8s.namespace),
    log_podName = tostring(LogMessage.k8s.podName),
    log_containerName = tostring(LogMessage.k8s.containerName),
    log_containerImage = tostring(LogMessage.runtime.containerImageName)
| where not(isempty(log_namespace))
| extend
    log_sni = tostring(LogMessage.name),
    log_pid = tostring(LogMessage.proc.pid),
    log_comm = tostring(LogMessage.proc.comm),
    log_parent = tostring(LogMessage.proc.parent.comm)
| project TimeGenerated, Computer, log_namespace, log_podName, log_containerName, log_containerImage, log_sni, log_pid, log_parent
The next example highlights system calls when seccomp profiles are applied to your pods. These profiles are crucial for understanding the interactions between applications and the operating system. This query retrieves logs related to system calls made by containers, offering insights into their behavior and potential security issues.
1
2
3
4
5
6
7
8
9
10
11
12
ContainerLogV2
| where ContainerName == "ig-seccomp"
| extend
    log_namespace = tostring(LogMessage.k8s.namespace),
    log_podName = tostring(LogMessage.k8s.podName),
    log_containerName = tostring(LogMessage.k8s.containerName),
    log_containerImage = tostring(LogMessage.runtime.containerImageName)
| extend
    log_syscall = tostring(LogMessage.syscall),
    log_syscall_id = tostring(LogMessage.syscall_raw),
    log_seccomp_ret_log = tostring(LogMessage.code)
| summarize count() by bin(TimeGenerated,1h), Computer, log_namespace, log_podName, log_containerName, log_containerImage, log_syscall, log_syscall_id, log_seccomp_ret_log
Another example focuses on dns traffic events. This is particularly useful for monitoring DNS queries and responses within your Kubernetes cluster, helping to identify potential issues or anomalies in name resolution.
1
2
3
4
5
6
7
8
9
10
11
12
13
14
15
16
17
18
19
20
21
22
23
24
25
26
27
28
29
30
31
32
33
34
35
ContainerLogV2
| where ContainerName == "ig-dns"
| extend
    log_namespace = tostring(LogMessage.k8s.namespace),
    log_podName = tostring(LogMessage.k8s.podName),
    log_containerName = tostring(LogMessage.k8s.containerName),
    log_containerImage = tostring(LogMessage.runtime.containerImageName)
| where not(isempty(log_namespace))
| extend
    log_id = tostring(LogMessage.id),
    log_gid = tostring(LogMessage.proc.creds.gid),
    log_uid = tostring(LogMessage.proc.creds.uid),
    log_pid = tostring(LogMessage.proc.pid),
    log_comm = tostring(LogMessage.proc.comm),
    log_parent = tostring(LogMessage.proc.parent.comm),
    log_qname = tostring(LogMessage.name),
    log_qr = tostring(LogMessage.qr),
    log_qtype = tostring(LogMessage.qtype),
    log_rcode = tostring(LogMessage.rcode),
    log_srcIp = tostring(LogMessage.src.addr),
    log_srcPort = tostring(LogMessage.src.port),
    log_dstIp = tostring(LogMessage.dst.addr),
    log_dstPort = tostring(LogMessage.dst.port),
    log_pktType = tostring(LogMessage.pkt_type),
    log_latency_ns = tostring(LogMessage.latency_ns),
    log_raddr = (LogMessage.addresses)
| where log_qtype == "A"
| extend log_qr = iff(log_qr == "R", "Response", iff(log_qr == "Q" , "REQUEST", log_qr))
| where log_qname !endswith ".cluster.local."
| where log_qr == "Response" and log_pktType == "HOST"
| where log_rcode !contains "Error"
| where log_comm != "coredns"
//----------------
| project TimeGenerated, Computer, log_namespace, log_podName, log_containerName, log_comm, log_qr, log_qtype, log_rcode, log_qname, log_raddr, log_srcIp, log_srcPort, log_dstIp, log_pktType
//| where log_podName contains "sample-pod"
Did you know, that Defender Container Sensor now has DNS Threat Detection included? Check the recent changelog here: https://learn.microsoft.com/en-us/azure/defender-for-cloud/defender-sensor-change-log
The last example involves tracing tcp connections, specifically retrieving the outbound public connections made by the pods. This is particularly useful for identifying external communication patterns and potential security threats.
1
2
3
4
5
6
7
8
9
10
11
12
13
14
15
16
17
18
19
20
21
22
23
24
25
26
27
28
29
30
ContainerLogV2
| where ContainerName == "ig-tcp"
| extend
    log_namespace = tostring(LogMessage.k8s.namespace),
    log_podName = tostring(LogMessage.k8s.podName),
    log_containerName = tostring(LogMessage.k8s.containerName),
    log_containerImage = tostring(LogMessage.runtime.containerImageName)
| where not(isempty(log_namespace))
| extend
    log_gid = tostring(LogMessage.proc.creds.gid),
    log_uid = tostring(LogMessage.proc.creds.uid),
    log_pid = tostring(LogMessage.proc.pid),
    log_comm = tostring(LogMessage.proc.comm),
    log_parent = tostring(LogMessage.proc.parent.comm),
    log_operation = tostring(LogMessage.type),
    log_ipversion = tostring(LogMessage.src.version),
    log_srcIp = tostring(LogMessage.src.addr),
    log_srcPort = tostring(LogMessage.src.port),
    log_dstIp = tostring(LogMessage.dst.addr),
    log_dstPort = tostring(LogMessage.dst.port)
//| where log_operation != "close"
//----------------
| where log_srcIp != "127.0.0.1"
| extend direction = iff(log_operation == "connect", "Outbound", iff(log_operation == "accept", "INBOUND",log_operation))
| extend remoteIp = iff(direction == "INBOUND", log_dstIp, log_srcIp)
//----------------
| where direction == "Outbound"
| where not(ipv4_is_private(log_dstIp))
| summarize count(), make_set(log_dstIp) by Computer, log_namespace, log_podName, log_containerName, log_containerImage, log_comm, log_parent, log_srcIp, direction, log_operation, log_dstPort
| project Computer, log_namespace, log_podName, log_containerName, log_containerImage, log_comm, log_parent, direction, log_operation, log_srcIp, set_log_dstIp, log_dstPort, count_
📌Key Takeaways and Limitations
While this approach provides a straightforward way to collect and analyze telemetry data from Kubernetes clusters at the edge, there are some limitations to consider:
IG does not offer filtering for specific namespaces or pods yet, which can result in a lot of noise in the logs and high log volume, including egress traffic. Therefore, it might be beneficial to use local logs initially, then filter and ingest them into the workspace. Maybe something for my next blog post? 😊
Arc-enabled clusters currently do not offer the option to split Container Insights into multiple workspaces for handling multi-tenant logging. This means that all logs from the Arc-enabled cluster will be sent to a single workspace, which can lead to challenges. See https://learn.microsoft.com/is-is/azure/azure-monitor/containers/container-insights-multitenant for more details.
When using IG with multiple gadgets simultaneously, it may consume a significant amount of resources. Each gadget operates in its own container and independently collects telemetry data, leading to increased memory and CPU usage on the nodes where the gadgets are deployed. In my tests with simulated traffic, setting the memory limit to 256Mi and the CPU limit to 90m worked well, but this may vary depending on the number of gadgets and the traffic volume.